Microsoft Excel is more than just a spreadsheet tool—it’s a powerhouse for data analysis and management. While many users stick to basic functionalities like data entry and simple calculations, Excel offers advanced features that can elevate your data expertise. Mastering these tools will not only make you more efficient but also enable you to unlock deeper insights from your data. Here are seven Excel features that can transform you into a data expert.
1. Pivot Tables
Why It’s Essential
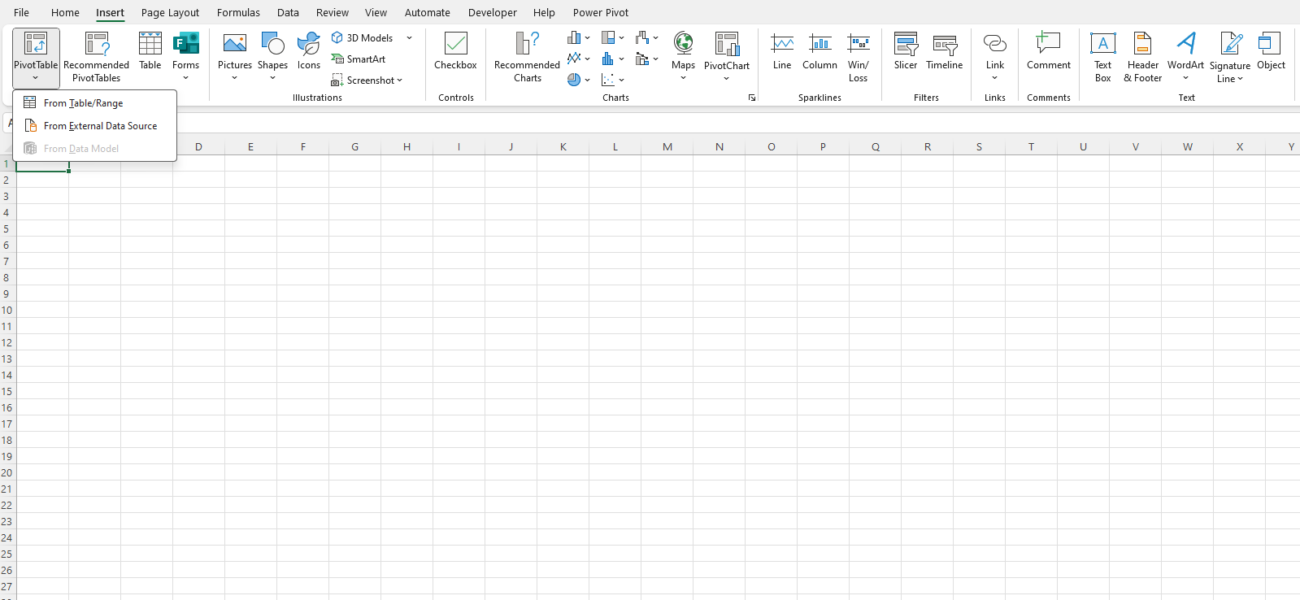
Pivot Tables are one of Excel’s most powerful tools, allowing you to summarize and analyze large datasets effortlessly. With just a few clicks, you can group, filter, and aggregate data to extract meaningful insights.
How to Use It
- Select your data range and go to Insert > Pivot Table.
- Drag fields into Rows, Columns, and Values areas to structure your report.
- Use filters and slicers for more dynamic interaction.
Pro Tip
Enable the “Value Field Settings” to display percentages, ranks, or custom calculations for deeper analysis.
2. Conditional Formatting
Why It’s Essential
Conditional formatting highlights trends, patterns, and outliers in your data by applying visual cues like colors, icons, or data bars.
How to Use It
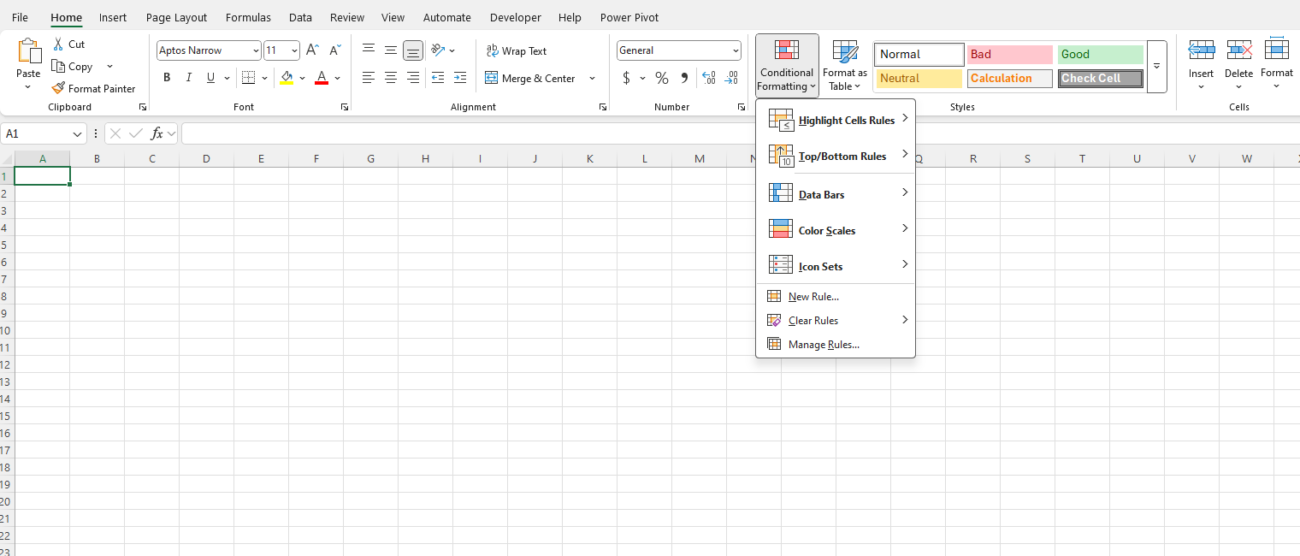
- Select a data range, then go to Home > Conditional Formatting.
- Choose a rule type (e.g., highlight cells greater than a specific value, top 10%, or duplicate values).
- Customize formats to suit your needs.
Pro Tip
Combine multiple rules to create advanced visualizations, like highlighting cells that meet multiple criteria.
3. Data Validation
Why It’s Essential
Data Validation helps maintain data accuracy by controlling what can be entered into a cell. It’s particularly useful for creating dropdown menus, restricting input types, or applying custom formulas for validation.
How to Use It
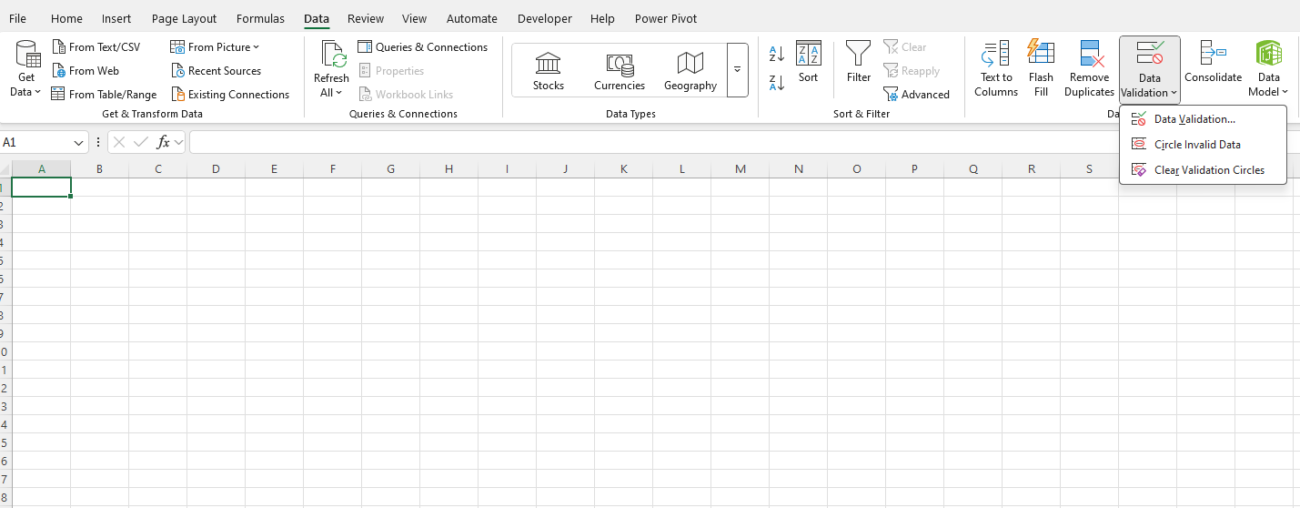
- Select your cells, then go to Data > Data Validation.
- Choose criteria like whole numbers, text length, or list options.
- Add input messages and error alerts for better user guidance.
Pro Tip
Use formulas in validation criteria to create dynamic dropdown lists or advanced restrictions.
4. Power Query
Why It’s Essential
Power Query simplifies the process of importing, cleaning, and transforming data from various sources (e.g., databases, web, CSV files). It’s a must-have for handling large datasets.
How to Use It
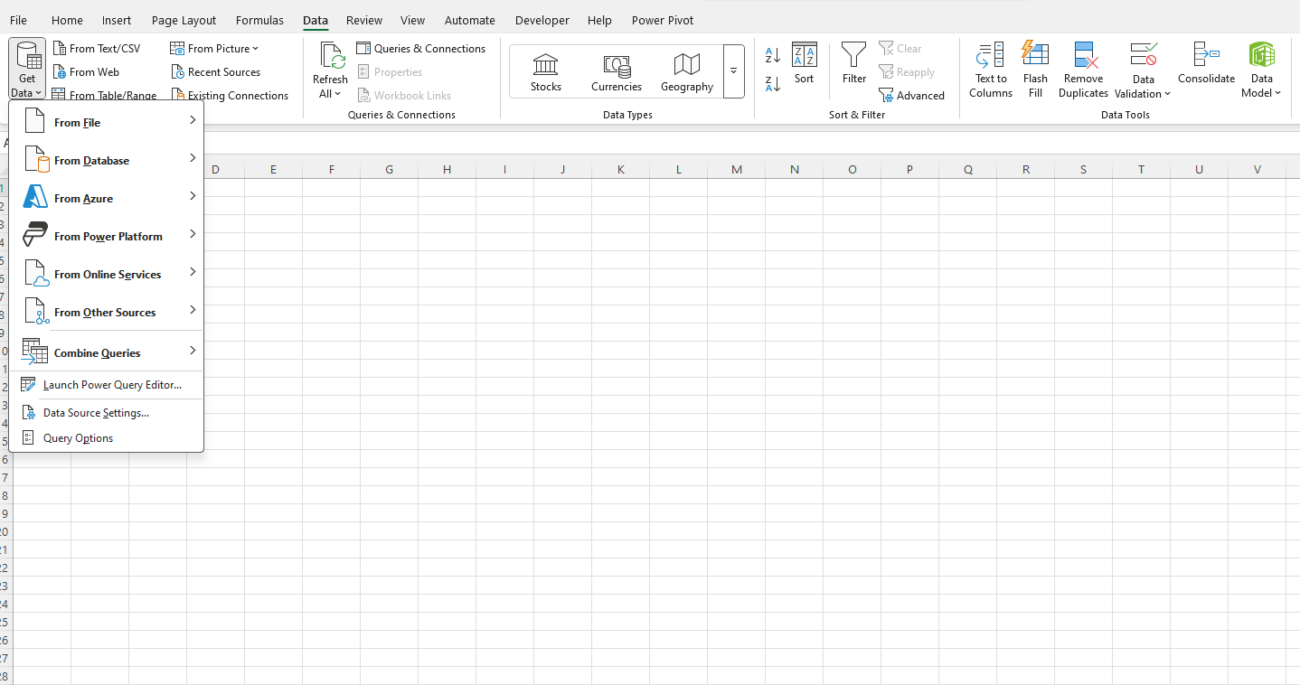
- Go to Data > Get Data and select your data source.
- Use the Power Query editor to filter, clean, and shape your data.
- Load the data back into Excel for analysis.
Pro Tip
Save Power Query steps to automate recurring data transformations and refresh them with a single click.
5. Advanced Formulas and Functions
Why It’s Essential
Excel offers a vast library of formulas to solve complex problems and automate calculations. Some must-know advanced functions include:
- INDEX-MATCH: A more flexible alternative to VLOOKUP for retrieving data.
- Formula:
=INDEX(array, MATCH(lookup_value, lookup_array, 0))
- Formula:
- TEXT Functions: Use
LEFT,RIGHT,CONCAT, orTEXTto manipulate strings. - ARRAYFORMULAS (Dynamic): Leverage functions like
FILTER,SORT, orUNIQUEfor dynamic, spillable results.
Pro Tip
Combine multiple formulas (nested formulas) to perform complex calculations in a single cell.
6. Charts and Graphs
Why It’s Essential
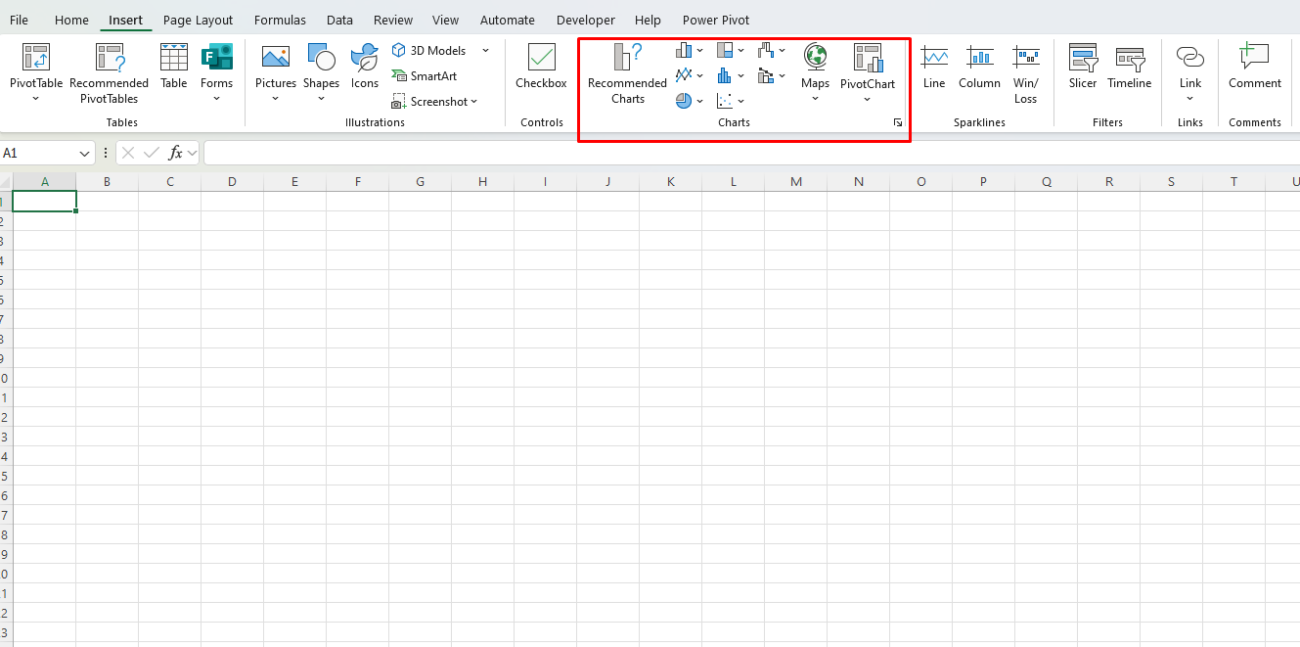
Visualizing data makes it easier to communicate insights effectively. Excel’s charting tools allow you to create line graphs, bar charts, pie charts, and more.
How to Use It
- Highlight your data and go to Insert > Charts.
- Choose a chart type that best represents your data.
- Customize chart elements like titles, labels, and colors.
Pro Tip
Use dynamic named ranges or tables to ensure your charts update automatically when new data is added.
7. Power Pivot
Why It’s Essential
Power Pivot is an advanced data modeling tool that allows you to handle millions of rows, create relationships between datasets, and perform complex calculations using Data Analysis Expressions (DAX).
How to Use It
- Enable Power Pivot through File > Options > Add-ins.
- Import data into the Power Pivot window.
- Create relationships between tables and use DAX formulas for calculated columns and measures.
Pro Tip
Use Power Pivot to build dashboards with multiple connected Pivot Tables for comprehensive analysis.
Get genuine Office Keys at unbeatable prices, offering the best value for your productivity needs.


