Create Engaging PowerPoint Infographics in Minutes
PowerPoint Infographics are a powerful way to present complex information in a visually appealing format. Whether you’re designing a business report, a marketing presentation, or an educational slideshow, PowerPoint makes it easy to create stunning infographics—fast! In this guide, we’ll show you how to craft engaging infographics in just a few minutes using built-in tools and smart design techniques.
1. Start with a Clear Concept
Before jumping into PowerPoint, outline your infographic’s purpose. Ask yourself:
✔ What key message am I trying to convey?
✔ Who is my audience?
✔ What type of visuals best support my data?
Once you have a clear goal, it’s easier to structure your infographic effectively.
2. Choose a Template or Start from Scratch
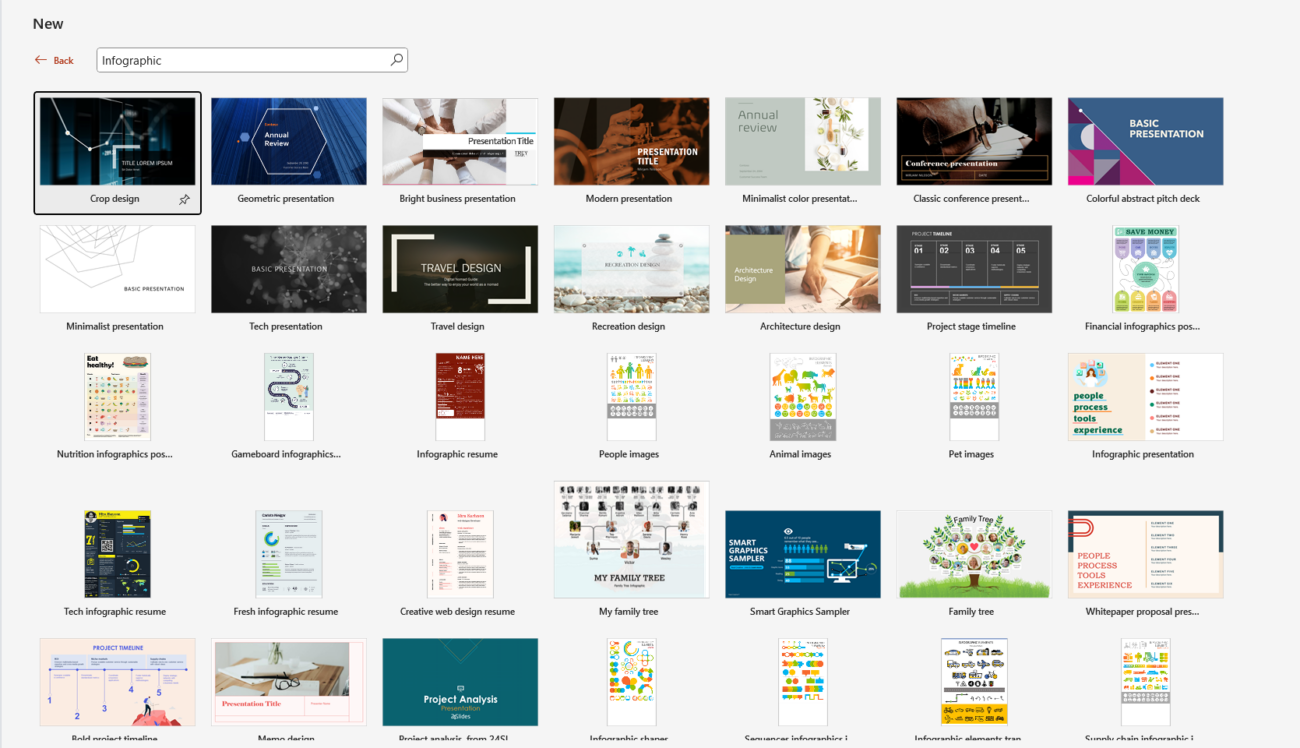
PowerPoint offers ready-made infographic templates that can save you time. To access them:
- Open PowerPoint → Click File → New
- Search for “Infographic” in the template search bar
- Choose a design that fits your needs

If you prefer a custom design, start with a blank slide and use shapes, icons, and SmartArt to create your layout.
3. Use SmartArt for Instant Visuals
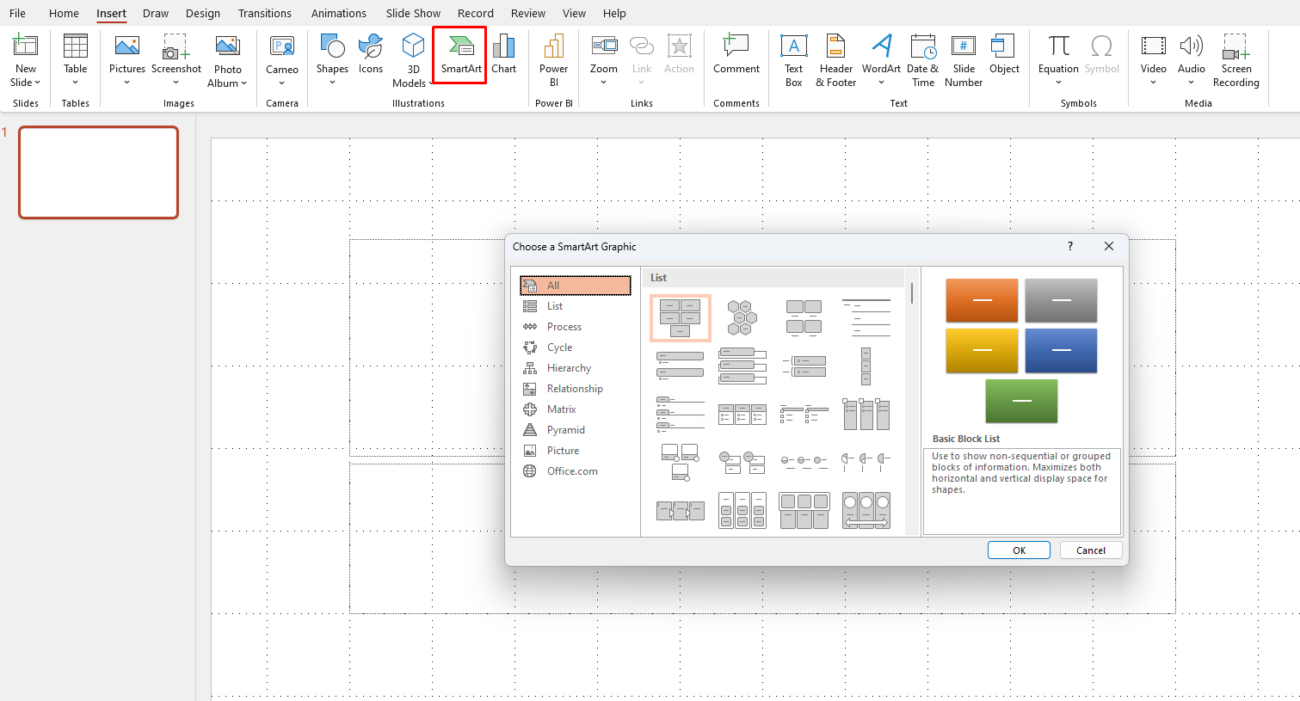
SmartArt is one of PowerPoint’s best-kept secrets for making infographics quickly. To use it:
- Go to Insert → Click SmartArt
- Choose from categories like Process, Cycle, Hierarchy, or Relationship
- Enter your text and customize the design with colors and styles

SmartArt automatically aligns and formats elements, making it easy to create professional-looking infographics in minutes.
4. Add Icons and Illustrations
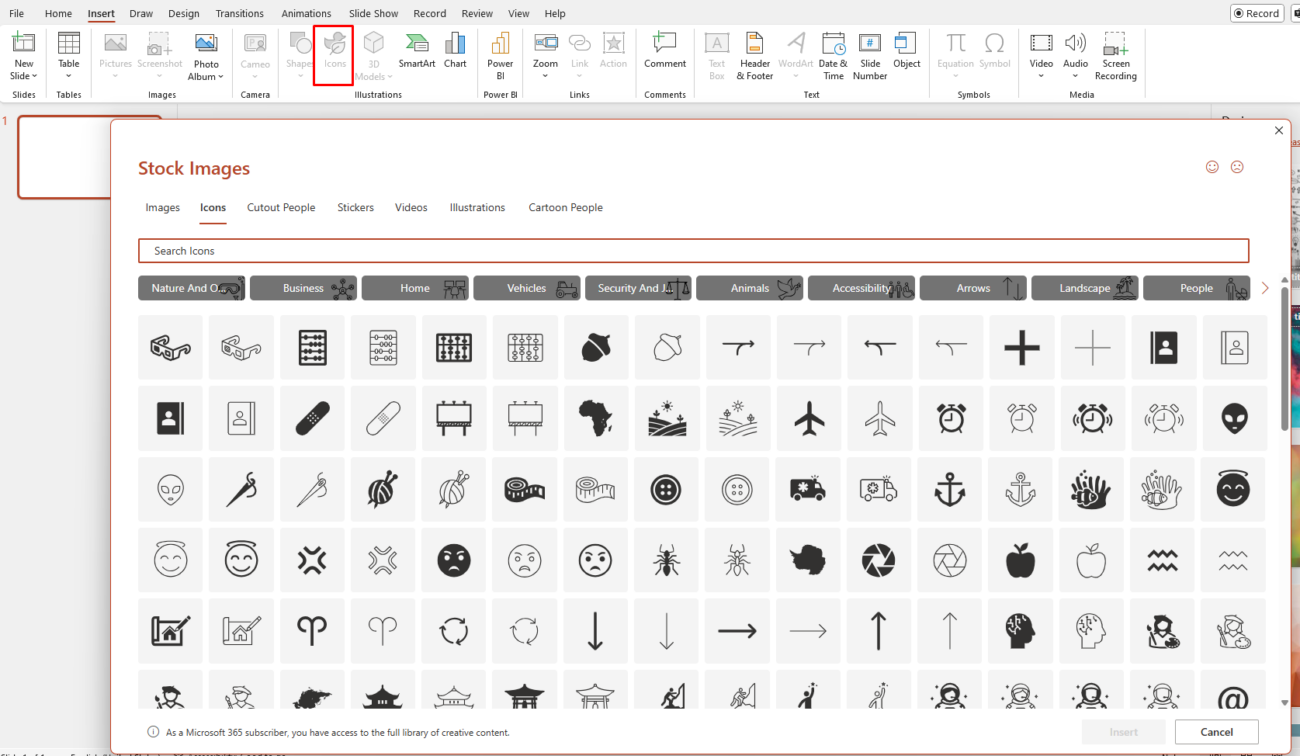
Icons make infographics visually appealing and easy to understand. PowerPoint has a built-in icon library:
- Click Insert → Icons
- Search for relevant icons (e.g., business, education, health)
- Resize and customize the color to match your theme

For extra visual appeal, you can also insert Illustrations under the Graphics tab.
5. Create Data Visualizations with Charts
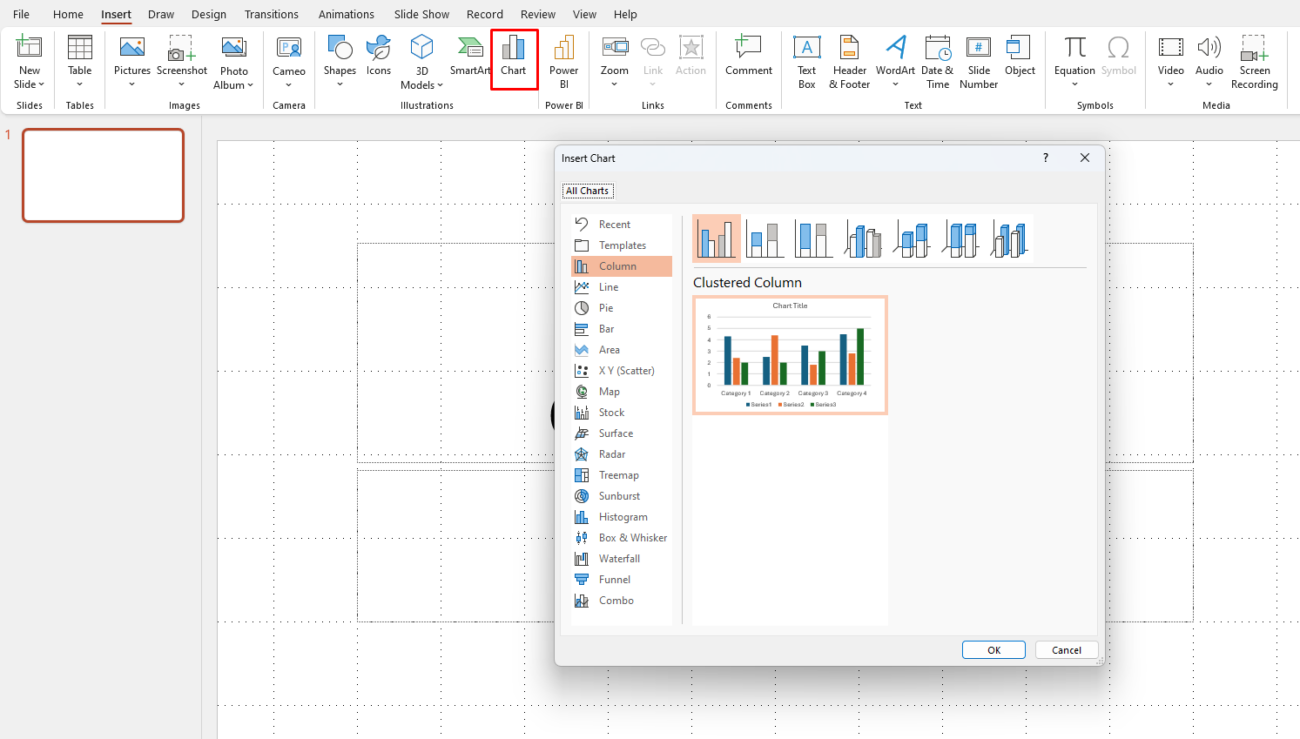
Instead of listing numbers, transform your data into charts for better impact:
- Go to Insert → Chart
- Select a style (pie, bar, line, etc.)
- Input your data and customize colors

If you need something simpler, use Data Bars from the Shape menu to create quick comparisons without using full charts.
6. Use Shapes to Build Custom Designs
Shapes help structure information visually. Try these tricks:
- Combine Shapes: Select multiple shapes → Click Shape Format → Merge Shapes
- Use Rounded Rectangles for smooth, modern designs
- Add Transparency to layer shapes for a sleek effect
7. Apply Consistent Colors & Fonts
A well-designed infographic uses a cohesive color scheme and fonts. To maintain consistency:
- Choose 3-5 colors that complement each other
- Stick to 2 fonts max (one for headers, one for body text)
- Use PowerPoint’s Design Ideas tool (under the Design tab) for automatic style suggestions
8. Animate Elements for Extra Engagement
A little animation can make your infographic more dynamic. To animate elements:
- Select an object → Click Animations
- Choose effects like Fade, Zoom, or Fly In
- Use Motion Paths to guide attention to key points
Keep animations subtle—too much movement can be distracting.
9. Save & Share Your Infographic
Once your infographic is ready, export it for easy sharing:
- Go to File → Save As
- Choose PNG or JPEG for images
- Select PDF for high-quality printing
For presentations, you can keep it as a PowerPoint slide or convert it into a video.
Get the cheapest genuine Office keys today and enjoy instant activation at unbeatable prices!

