Excel Data Analysis for Marketing Campaigns
In the fast-paced world of marketing, data-driven decision-making is key to creating successful campaigns. Microsoft Excel is a versatile tool that empowers marketers to analyze campaign performance, optimize strategies, and measure ROI effectively. This guide will walk you through the essentials of using Excel for marketing data analysis.
1. Setting Up Your Data
Before diving into analysis, ensure your data is well-organized. Import campaign data from various sources like Google Analytics, social media platforms, or email marketing tools into Excel.
Steps to Prepare Data:
- Clean Data: Remove duplicates, fill in missing values, and standardize formats.
- Organize Columns: Use clear headers such as “Campaign Name,” “Clicks,” “Impressions,” “Conversions,” and “Revenue.”
- Create Tables: Convert datasets into Excel tables for better organization and dynamic range handling.
2. Key Metrics to Track
Excel allows you to calculate and analyze key performance indicators (KPIs) to evaluate your marketing campaigns.
Common Marketing KPIs:
- Click-Through Rate (CTR):
= (Clicks / Impressions) * 100 - Conversion Rate:
= (Conversions / Clicks) * 100 - Cost Per Click (CPC):
= Total Cost / Clicks - Return on Investment (ROI):
= (Revenue - Cost) / Cost * 100
3. Using Pivot Tables for Insights
Pivot tables are powerful for summarizing and analyzing marketing data. They allow you to quickly identify trends and patterns.
Steps to Create a Pivot Table:
- Select Data: Highlight your dataset.
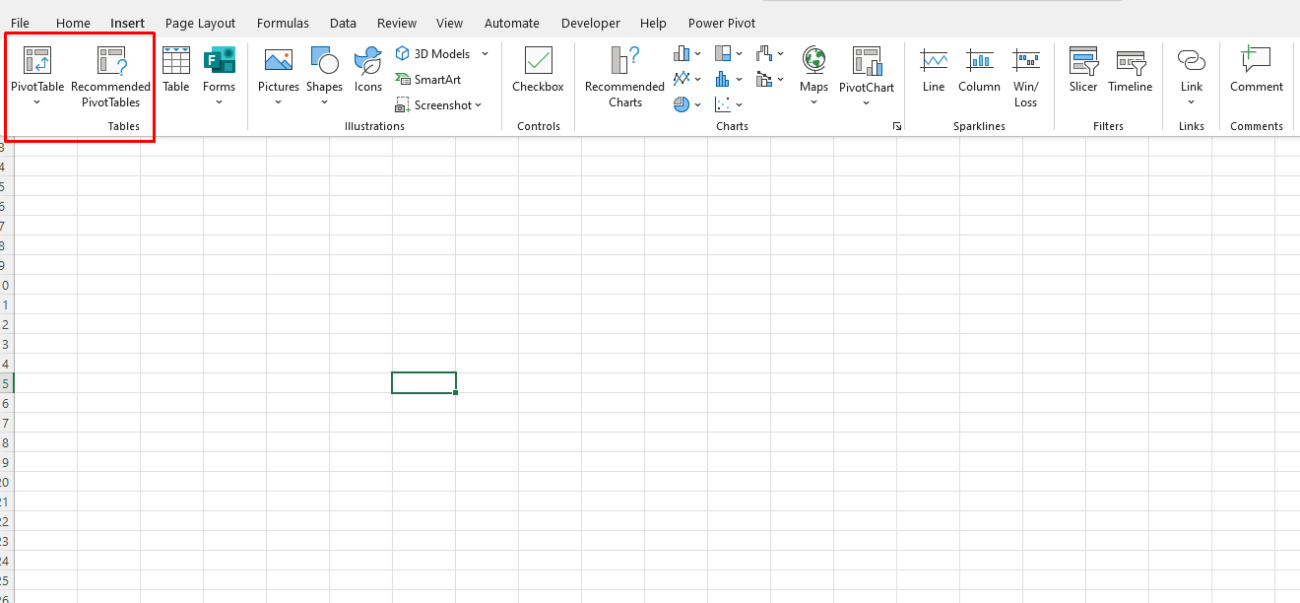
- Insert Pivot Table: Go to the “Insert” tab and select “Pivot Table.”
- Drag and Drop Fields: Place metrics like “Revenue” in the values section and dimensions like “Campaign Name” or “Date” in rows or columns.

Use Case:
- Compare campaign performance across different channels or time periods.
4. Visualizing Data with Charts
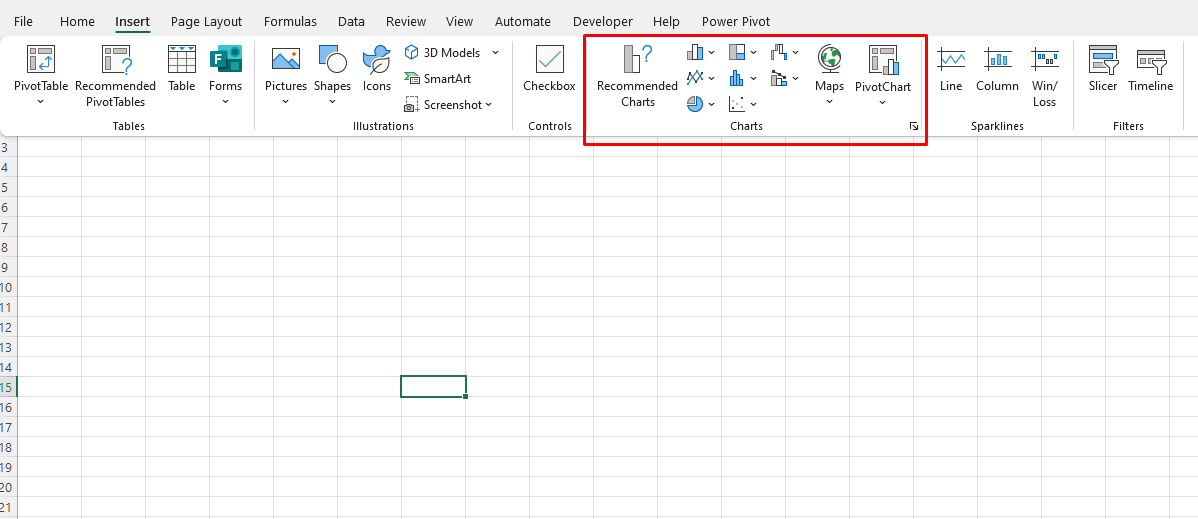
Data visualization makes it easier to communicate insights to stakeholders. Excel provides several chart types that are ideal for marketing analysis.
Recommended Charts for Marketing:
- Bar/Column Charts: Compare campaign performance metrics like clicks or conversions.
- Line Charts: Show trends over time, such as weekly revenue growth.
- Pie Charts: Highlight proportions, like the share of traffic from various sources.

5. Advanced Analysis with Formulas
Excel’s built-in formulas help automate calculations and uncover deeper insights into your campaign data.
Essential Formulas:
- IF Function: Identify campaigns exceeding certain thresholds.
Example:=IF(CTR > 5%, "High Performance", "Low Performance") - VLOOKUP: Match and retrieve specific data from large datasets.
- SUMIF/AVERAGEIF: Aggregate data based on conditions, such as total revenue from campaigns with high CTR.
6. Predictive Analysis with Forecasting Tools
Excel’s forecasting features allow you to predict future trends based on historical data, helping you plan upcoming campaigns more effectively.
Steps:
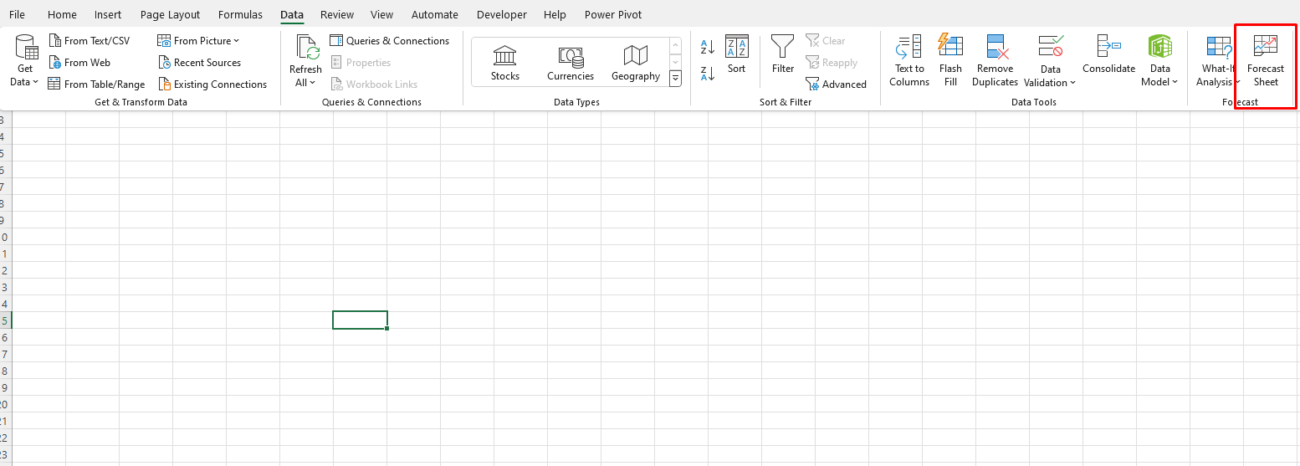
- Go to the “Data” tab.
- Use the “Forecast Sheet” tool to project metrics like impressions or conversions.
- Analyze the output to identify potential growth opportunities.

7. Collaboration and Reporting
Excel simplifies collaboration and reporting, ensuring all stakeholders stay informed about campaign performance.
Tips:
- Use Pivot Charts for dynamic visual summaries.
- Create dashboards combining key metrics, charts, and summaries on one sheet.
- Share your workbook via cloud platforms like OneDrive for real-time collaboration.
8. Automating Repetitive Tasks
For ongoing campaigns, save time by automating data analysis tasks using Excel’s features:
- Macros: Automate repetitive tasks like formatting or applying formulas.
- Power Query: Import, clean, and transform data automatically.
Unlock the best deals on genuine Office keys at unbeatable prices—boost your productivity without overspending!

