How do you use the FORECAST Function in Excel?
The FORECAST function in Excel is a powerful tool to predict future values based on existing data. This step-by-step guide will walk you through how to use the FORECAST function to make accurate data projections.
Step 1: Open Microsoft Excel and Enter Your Data
- Open Microsoft Excel on your computer.
- Enter your dataset into a new worksheet. Make sure your data includes both independent variables (X values) and dependent variables (Y values).
Step 2: Identify the Input for the FORECAST Function
- Determine the point you want to forecast by identifying your X value. For instance, if you want to predict sales for July (Month 7), your X value would be 7.
Step 3: Enter the FORECAST Function
- Click on an empty cell where you want the forecasted value to appear.
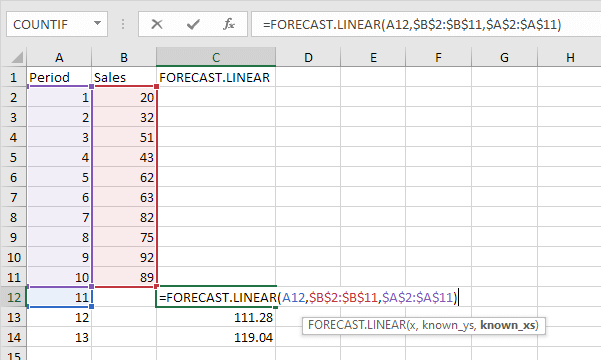
- Enter the FORECAST function in the following format:
=FORECAST(x, known_y's, known_x's)x: The data point you wish to predict (e.g., 7 for July).known_y's: The range of your dependent variable (Y values). For example,B2:B7for sales.known_x's: The range of your independent variable (X values). For example,A2:A7for months.
=FORECAST(7, B2:B7, A2:A7)

Step 4: Press Enter to Calculate the Forecast
- After typing in the formula, press
Enter. - The cell will display the forecasted value for the given X value (in this case, the sales for July).
Step 5: Verify and Interpret the Results
- Check the forecasted value to ensure it aligns with the trend and patterns in your dataset.
- For example, if the forecasted value for July is 340, verify it fits the increasing trend of sales over the previous months.
Step 6: Extend the Forecast to Multiple Values
- If you want to forecast multiple values, you can use the same formula format for different X values.
- Alternatively, use the
Fill Handleto drag the formula down to adjacent cells to forecast sequentially.Example:=FORECAST(8, B2:B7, A2:A7) // For forecasting August sales=FORECAST(9, B2:B7, A2:A7) // For forecasting September sales
Step 7: Chart Your Data and Forecast
- Highlight your original data plus the forecasted values.
- Go to the
Inserttab on the Ribbon. - Choose an appropriate chart type (e.g., Line Chart).
- Adjust the chart as necessary to clearly show the forecasted data points along with the original dataset.
Step 8: Save and Share Your Work
- Save your Excel workbook to avoid any data loss:
- Go to
File>Save Asand select the desired file location and format.
- Go to
- Share your forecast results with colleagues or stakeholders by emailing the workbook or exporting it as a PDF:
- To export as PDF, go to
File>Save As, choose PDF from the file type dropdown menu, and clickSave.
- To export as PDF, go to
Unlock incredible deals on Office Keys at the lowest prices available exclusively on our website!

