How do you insert an Organizational Chart in PowerPoint?
Organizational charts, also known as org charts, are essential for visualizing the structure of a company, division, or team. They help clarify roles, responsibilities, and reporting relationships, making them invaluable tools for presentations and communication. In this blog post, we’ll guide you through the step-by-step process of inserting an organizational chart in PowerPoint.
Step 1: Open PowerPoint and Create a New Slide
- Launch Microsoft PowerPoint.
- Open an existing presentation or create a new one.
- Insert a new slide where you want to place the organizational chart.
- Go to the Home tab.
- Click on New Slide.
- Choose a slide layout that suits your needs (e.g., Title and Content).
Step 2: Insert a SmartArt Graphic
- Click on the slide to select the content area.
- Navigate to the Insert tab on the ribbon.
- Click on SmartArt in the Illustrations group.

Step 3: Choose an Organizational Chart Layout
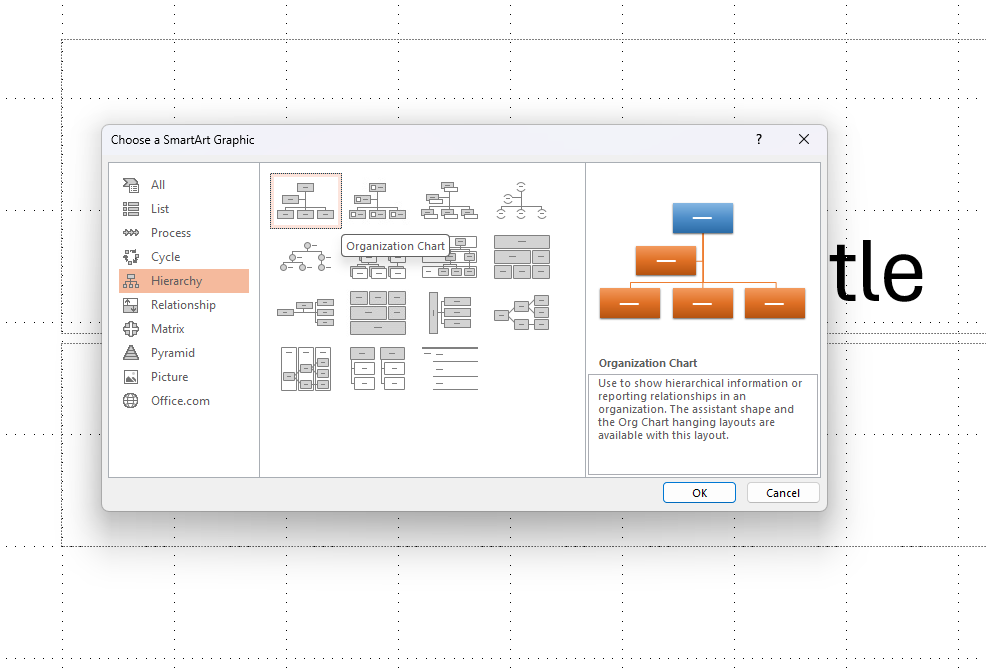
- In the Choose a SmartArt Graphic dialog box, select Hierarchy from the left pane.
- Choose an organizational chart layout that suits your needs (e.g., Organization Chart).
- Click OK to insert the chosen layout into your slide.

Step 4: Enter Text for Each Shape
- Click on the [Text] placeholders in the SmartArt graphic to enter text.
- Type in the name and title of each individual in the organizational chart.
- To add more shapes (boxes) to your chart:
- Click on a shape to select it.
- Go to the SmartArt Tools Design tab on the ribbon.
- Click on the Add Shape dropdown in the Create Graphic group.
- Choose where to add the new shape (e.g., Add Shape Below, Add Shape Above, Add Shape After, or Add Shape Before).
Step 5: Customize the Organizational Chart
- Click on the organizational chart to select it.
- Navigate to the SmartArt Tools Design tab.
- Use the available options to style your chart:
- Change Colors: Click on Change Colors to select a color scheme that matches your presentation theme.
- SmartArt Styles: Use the style gallery to quickly apply a new style or visual effect to your chart.
- Text Pane: Use the text pane on the left to add or edit text and hierarchy more easily.
Step 6: Format Individual Shapes and Text
- Click on any shape within the organizational chart to select it.
- Go to the SmartArt Tools Format tab.
- Use the available formatting options:
- Shape Fill: Change the fill color of the selected shape.
- Shape Outline: Modify the outline color and weight.
- Shape Effects: Apply effects such as shadows, reflections, or glows.
- Text Fill, Text Outline, and Text Effects: Customize the text appearance within the shapes.
Step 7: Adjust the Layout
- Click on the organizational chart to select it.
- In the SmartArt Tools Design tab, use the Rearrange options to change the layout:
- Promote or Demote shapes to move them up or down the hierarchy.
- Move Up or Move Down to adjust the position of shapes within the same level.
Unlock the full potential of your productivity by purchasing the cheapest Office Keys available, offering all the features you need at an unbeatable price.

