Designing PowerPoint Infographics to Simplify Complex Data
Simplifying complex data into easily digestible visuals is a must for effective communication. PowerPoint is a versatile tool that allows you to design compelling infographics, transforming overwhelming numbers and statistics into engaging, easy-to-understand graphics. Let’s explore how to create impactful PowerPoint Infographics that make your data clear and memorable.
Why Use Infographics in PowerPoint?
Infographics blend visuals and data to tell a story. They help your audience:
- Understand complex information at a glance.
- Retain key insights better through visual cues.
- Stay engaged during your presentation.
With PowerPoint’s array of tools, creating professional infographics doesn’t require advanced graphic design skills.
Steps to Design Effective Infographics in PowerPoint
1. Define Your Purpose and Audience
Before you begin, identify the key message you want to communicate. Understanding your audience will help you decide the tone, style, and level of detail for your infographic.
2. Choose the Right Layout
PowerPoint offers pre-designed templates and layouts for infographics, which can save time. Alternatively, create a custom layout by arranging shapes, text boxes, and images in a clear hierarchy.
3. Visualize Data Effectively
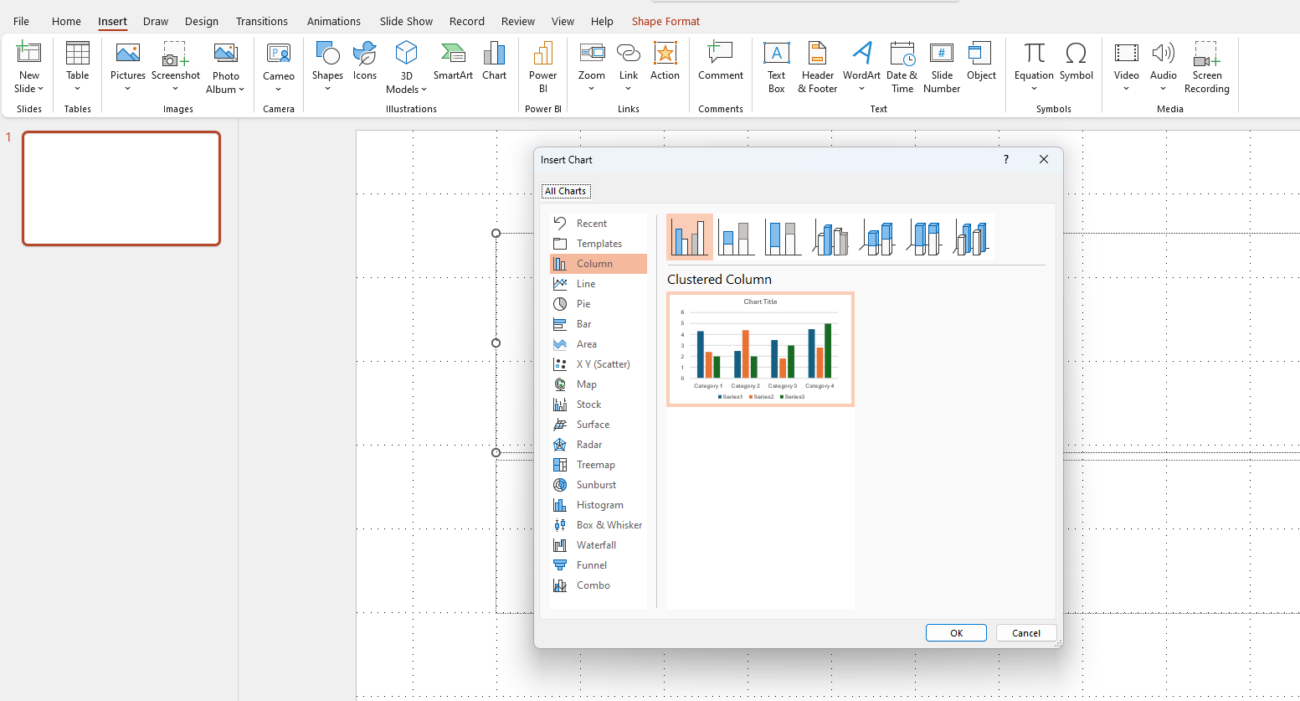
- Use charts, graphs, and diagrams to represent numbers and trends.
- Choose the appropriate type of chart:
- Bar charts for comparisons.
- Pie charts for proportions.
- Line graphs for trends over time.
- Combine multiple data points in creative ways, such as flowcharts or Venn diagrams.

4. Stick to a Cohesive Design
- Color Palette: Use a consistent, limited color scheme that aligns with your topic or brand. Contrasting colors help emphasize important points.
- Typography: Limit your fonts to two—one for headings and one for body text. Ensure they are readable and professional.
- Icons and Images: Use high-quality, relevant icons and visuals to add context without cluttering the slide.
5. Focus on Simplicity
Avoid overloading your infographic with excessive text or visuals. Aim for a clean, minimalist design that highlights the most important information.
PowerPoint Tools for Infographics
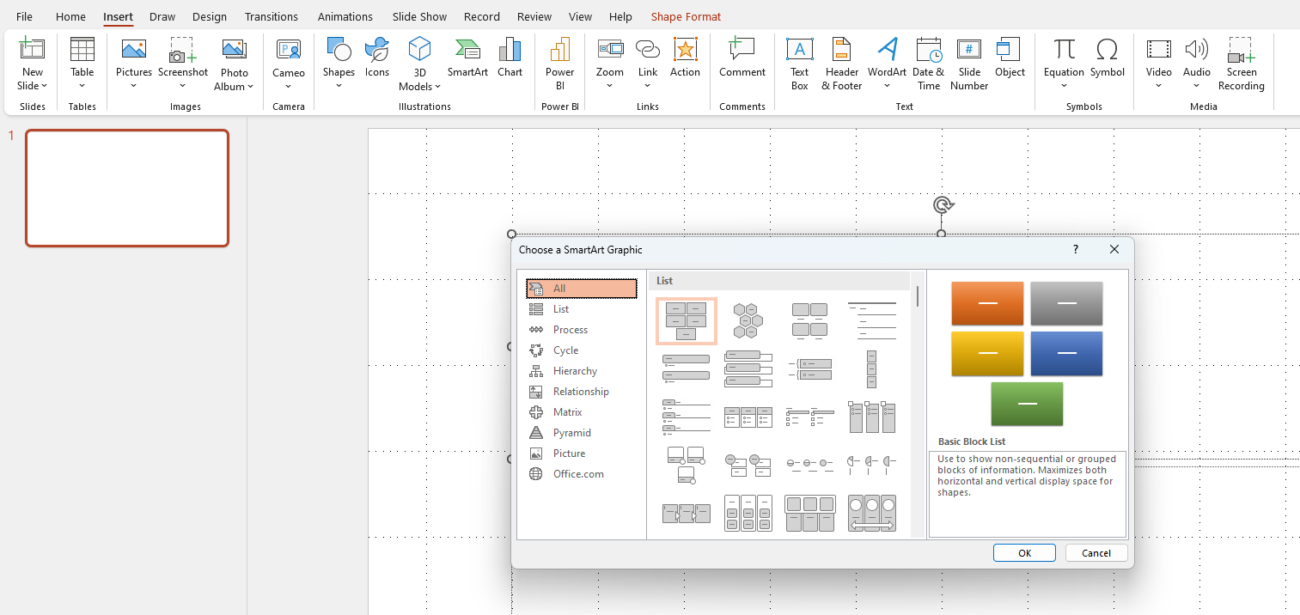
SmartArt Graphics
PowerPoint’s SmartArt feature allows you to create diagrams, process flows, and hierarchies quickly. It’s perfect for beginners looking for pre-designed layouts.

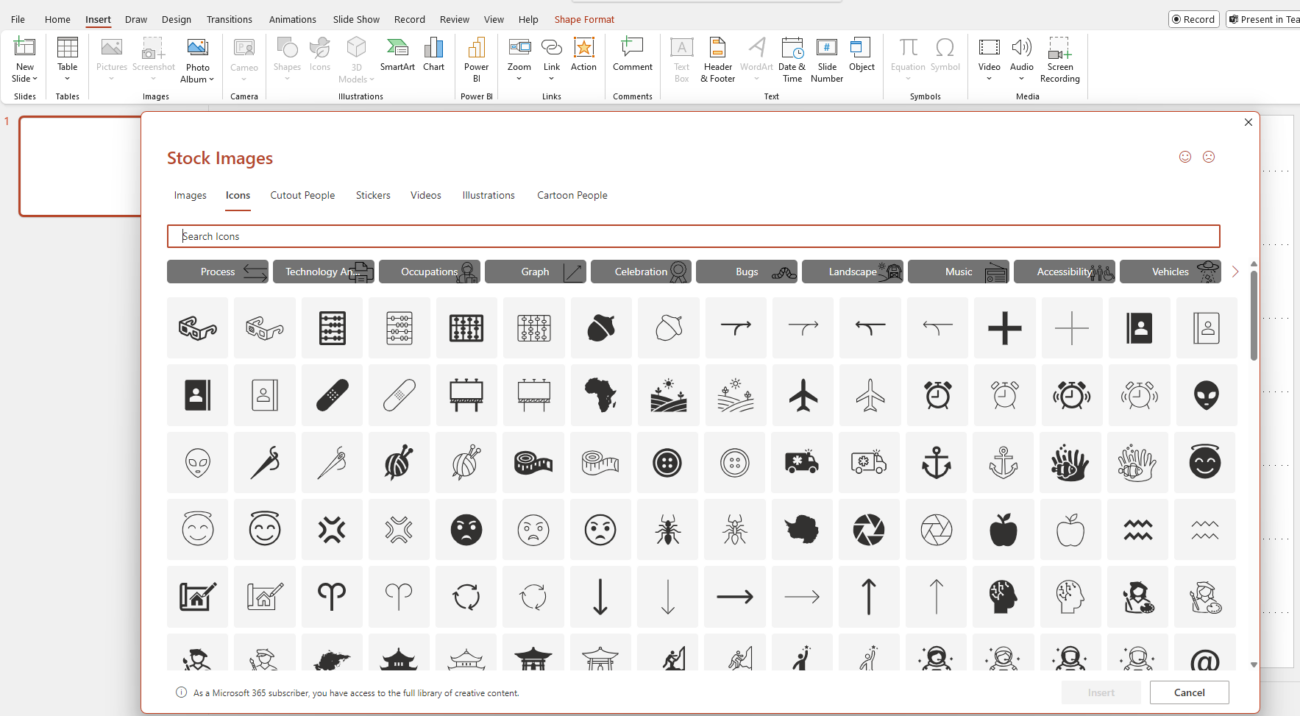
Shapes and Icons
Leverage PowerPoint’s library of shapes and icons to create custom designs. Combine basic shapes to form unique graphics.

Animations and Transitions
Use subtle animations to reveal information gradually. For instance, animate each data point to appear one at a time for better audience focus.


Get the cheapest Office keys online with instant delivery and secure activation—quality software at unbeatable prices!

