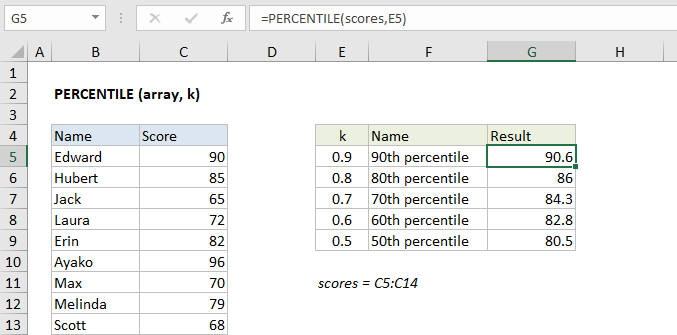
How do you use the PERCENTILE Function in Excel?
The PERCENTILE function in Excel is a powerful tool that allows you to determine the value below which a given percentage of data falls. Follow these step-by-step instructions to accurately use the PERCENTILE function and make the most out of your data analysis.
Step 1: Prepare Your Data
- Open Microsoft Excel and create a new workbook.
- Enter your data into a column. For example, input your data into column A from cell A1 to A10.
A1 102 123 144 165 186 207 228 249 2610 28Step 2: Select the Target Cell for the PERCENTILE Result
- Click on the cell where you want to display the result of the PERCENTILE function. For example, click on cell B1.
Step 3: Enter the PERCENTILE Function
- In the selected cell, type the formula:
=PERCENTILE(array, k). - Replace
arraywith the range of your data. In this example, it will beA1:A10. - Replace
kwith the desired k-th percentile value. For example, to find the 25th percentile, enter0.25.
=PERCENTILE(A1:A10, 0.25)
Step 4: Execute the Formula
- Press
Enterto calculate the result. - The value corresponding to the 25th percentile will be displayed in the selected cell (B1 in this case).
Step 5: Interpret the Results
- Understand the output displayed. For example, if cell B1 now shows 12.5, this indicates that 25% of the data values are below 12.5.
Step 6: Calculate Different Percentiles
- Repeat the same steps to calculate other percentiles. Simply change the
kvalue in the PERCENTILE function. - For the 50th percentile (median), you would use:
=PERCENTILE(A1:A10, 0.5)- For the 75th percentile, use:
=PERCENTILE(A1:A10, 0.75)- Place each calculation result in respective cells, like B2 for the 50th percentile and B3 for the 75th percentile.
Step 7: Visualization (Optional)
- To visualize the percentiles within your data, you can create a simple chart.
- Select your data range, including the percentiles, by holding
Ctrland clicking each relevant cell. - Go to the
Inserttab and choose an appropriate chart type, such as aLine ChartorBar Chart.
Step 8: Save Your Work
- Once your percentile calculations and any visualizations are complete, save your workbook.
- Click
File>Save As, then choose a location and filename for your work.
Unlock genuine productivity with our affordable Office Keys, ensuring you have access to the latest Microsoft Office tools for all your needs.

