Using Excel Tables for Dynamic Data Management
Excel is a versatile tool for data management, and one of its most powerful features is the ability to create tables. Excel tables provide an efficient way to organize, analyze, and manage data dynamically. In this blog post, we’ll explore the benefits of using Excel tables, how to create and customize them, and practical tips to maximize their potential.
1. What Are Excel Tables?
Excel tables are structured ranges that allow you to manage and analyze data effectively. When you convert a range of data into a table, Excel enhances its functionality by adding features like filtering, sorting, and automatic formatting. Tables also enable easy referencing in formulas, making your data management more intuitive.
2. Benefits of Using Excel Tables
A. Improved Data Organization
Tables help keep your data organized with built-in features such as headers and banded rows. This formatting enhances readability and allows you to quickly identify important information.
B. Dynamic Range Management
One of the standout features of Excel tables is their dynamic nature. When you add new data to a table, Excel automatically expands the table range. This means that formulas, charts, and pivot tables referencing the table are updated instantly, saving you time and effort.
C. Enhanced Filtering and Sorting
Excel tables come with built-in filtering and sorting options. You can quickly filter your data based on specific criteria or sort it alphabetically, numerically, or by date, making data analysis more efficient.
D. Structured References
When you create formulas within a table, you can use structured references, which refer to table columns by name rather than cell references. This makes your formulas easier to read and understand. For example, instead of using =SUM(A2:A10), you can use =SUM(Table1[Sales]).
3. How to Create an Excel Table
Creating an Excel table is straightforward:
- Select Your Data: Highlight the range of data you want to convert into a table.
- Insert Table:
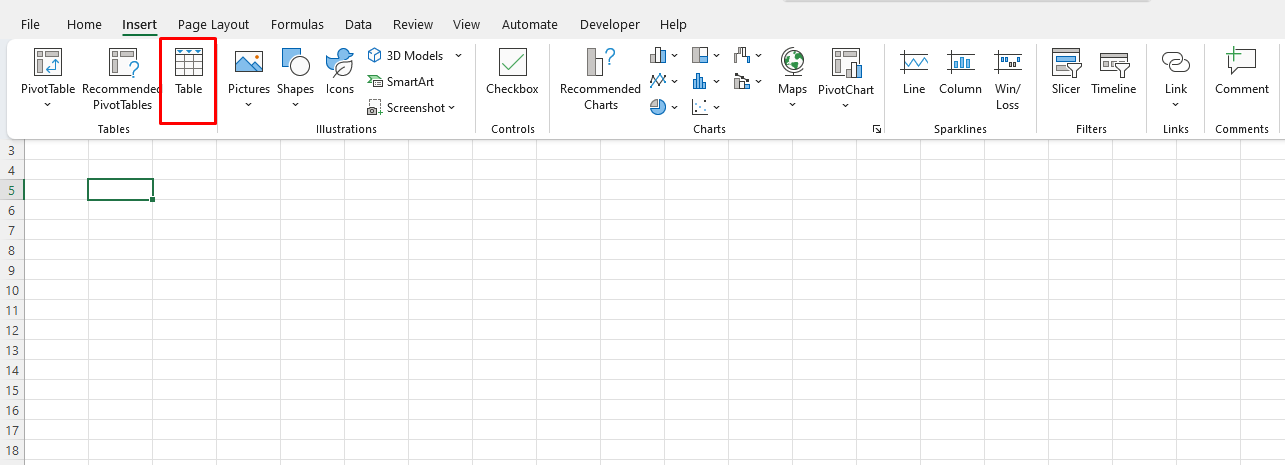
- Go to the Insert tab on the ribbon.
- Click on Table.
- Create Table Dialog Box: A dialog box will appear. Ensure that the “My table has headers” checkbox is checked if your data includes headers. Click OK.
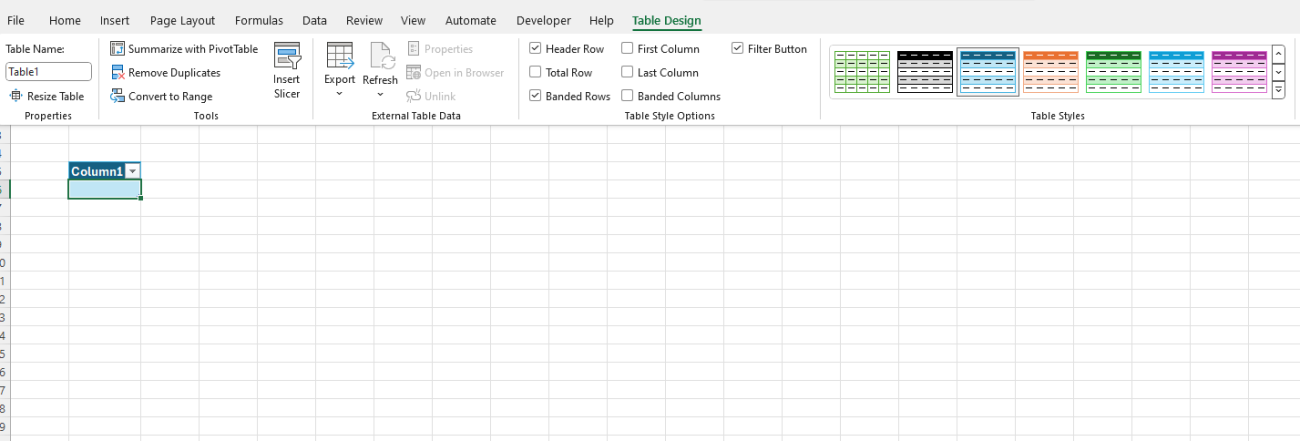
- Customize Your Table: Once your table is created, you can customize it using the Table Design tab. Here, you can change the table style, add total rows, and modify other settings.

4. Customizing Excel Tables
A. Table Styles
Excel provides a variety of pre-defined table styles that you can apply to enhance the visual appeal of your data. To change the style:
- Click on your table.
- Go to the Table Design tab.
- Select a style from the Table Styles gallery.

B. Adding Total Rows
To add a total row at the bottom of your table:
- Select your table.
- Go to the Table Design tab.
- Check the Total Row option.
This will insert a new row at the bottom of the table where you can use functions like SUM, AVERAGE, and COUNT to perform calculations on the table data.
C. Filtering and Sorting Data
You can easily filter and sort your data using the dropdown arrows in the header row. Click the arrow next to a column header to access sorting and filtering options. This functionality allows you to quickly view specific subsets of your data without altering the original dataset.
Get the best deals on the cheapest Office keys, ensuring you have access to essential software at unbeatable prices!

