Advanced Excel Techniques for HR Analytics
Human Resources (HR) departments are increasingly turning to data analytics to improve decision-making, enhance employee experiences, and drive organizational success. Microsoft Excel, with its powerful tools and functionalities, remains a cornerstone for HR analytics. Whether it’s tracking employee performance, analyzing retention rates, or forecasting workforce needs, mastering advanced Excel techniques can significantly elevate your HR analytics game.
1. Creating Dashboards for HR Metrics
Dashboards provide a consolidated view of key HR metrics, such as employee turnover, hiring rates, and training costs. Excel makes it simple to design interactive dashboards.
Steps to Create an HR Dashboard:
- Organize your data in structured tables.
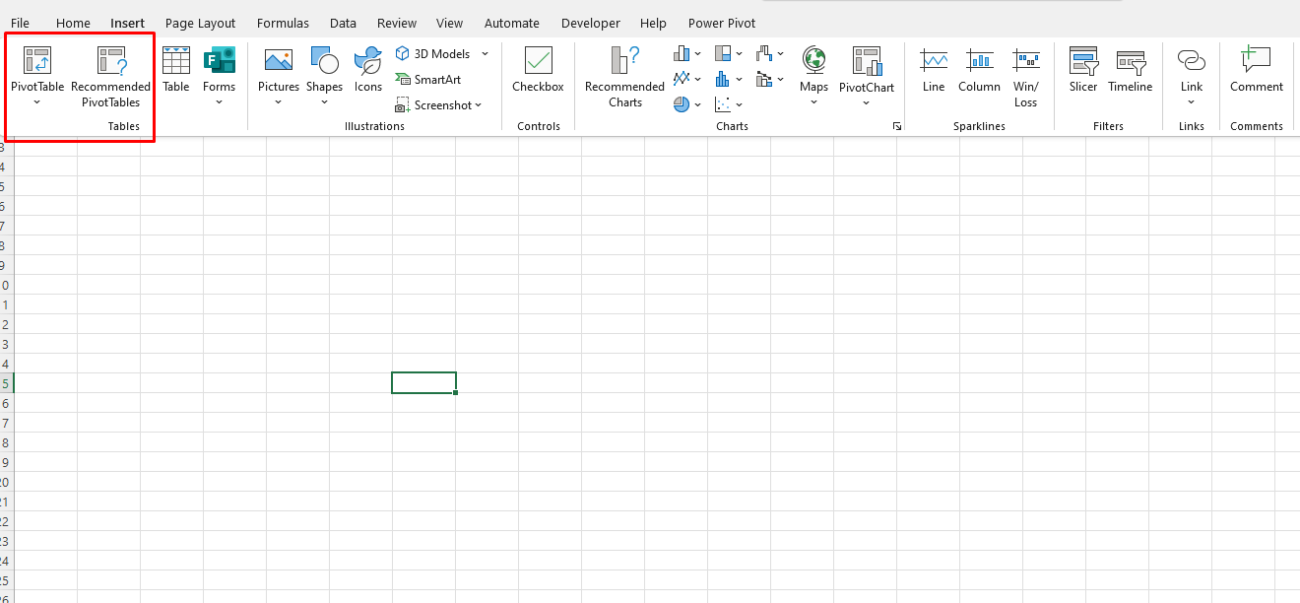
- Use PivotTables to summarize metrics like headcount, retention, or absenteeism.
- Add charts such as bar graphs or line charts to visualize trends.
- Use slicers and timelines to filter data dynamically.

Example: A dashboard tracking turnover rates by department over time.
2. Leveraging Power Query for Data Preparation
HR analytics often involves consolidating data from multiple sources, like payroll software, performance tracking systems, or surveys. Power Query simplifies data cleaning and transformation.
Key Benefits of Power Query:
- Automate data imports from external sources.
- Clean and normalize datasets (e.g., remove duplicates or handle missing data).
- Merge and append multiple datasets efficiently.
Example: Combining employee data from an applicant tracking system (ATS) with payroll data for comprehensive reporting.
3. Using Advanced Formulas for HR Analysis
Excel’s advanced formulas can help HR professionals calculate metrics, forecast trends, and analyze workforce data.
Essential Formulas:
- IF with AND/OR: Evaluate multiple conditions (e.g., identifying employees eligible for promotion).
=IF(AND(PerformanceScore>4, Tenure>=2), "Eligible", "Not Eligible") - VLOOKUP/XLOOKUP: Retrieve employee details from large datasets.
- TEXT Functions: Format and extract information, such as separating first and last names.
- ARRAY Formulas: Perform calculations across ranges for advanced analytics.
Example: Calculate average tenure per department or flag employees nearing retirement.
4. Predictive Analytics with Forecasting Tools
Excel’s forecasting capabilities allow HR teams to predict future workforce needs based on historical data.
How to Use Forecasting:
- Organize data by time periods (e.g., monthly hiring trends).
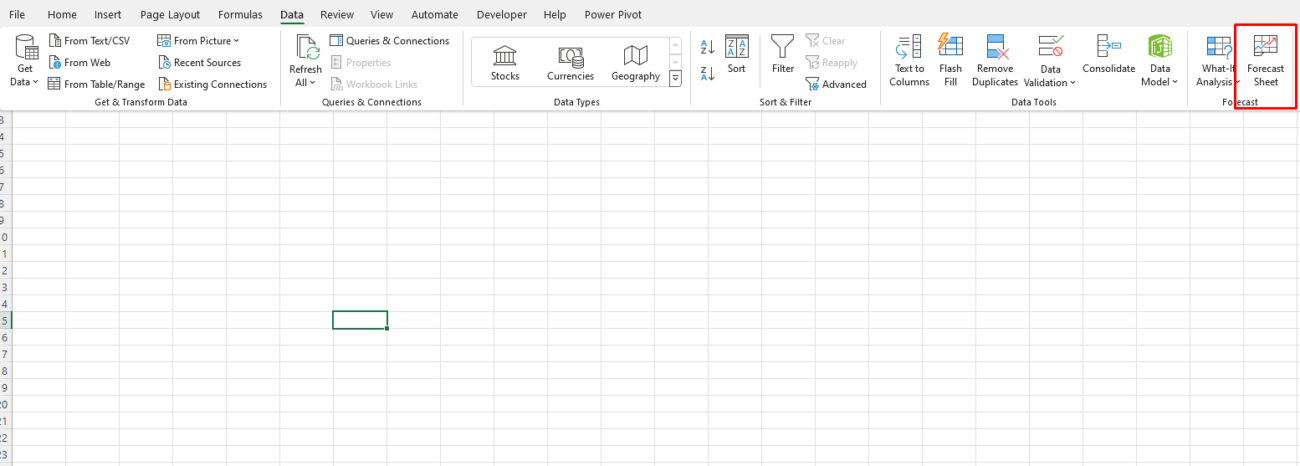
- Use the ‘Forecast Sheet’ feature under the Data tab to predict future trends.
- Customize the confidence intervals and visualize results.

Example: Forecast employee turnover rates to plan recruitment strategies proactively.
5. Analyzing Workforce Data with PivotTables
PivotTables are invaluable for HR professionals seeking to analyze workforce data quickly and flexibly.
Key Uses in HR Analytics:
- Summarize data, such as employee demographics or performance ratings.
- Analyze data by categories like department, role, or location.
- Drill down into specific groups to identify trends or anomalies.
Example: Comparing average salaries across job roles to identify disparities.
6. Conducting Sentiment Analysis Using Text Functions
Understanding employee sentiment from survey data can offer actionable insights. Excel’s text functions can help process and analyze qualitative data.
Steps:
- Extract key phrases using functions like
SEARCHorFIND. - Count occurrences of positive or negative words with the
COUNTIFfunction. - Visualize the sentiment using bar charts or word clouds.
Example: Analyzing open-ended feedback from employee engagement surveys.
7. Automating Repetitive Tasks with Macros
HR tasks like generating monthly reports or processing payroll data can be automated using macros.
Steps to Create a Macro:
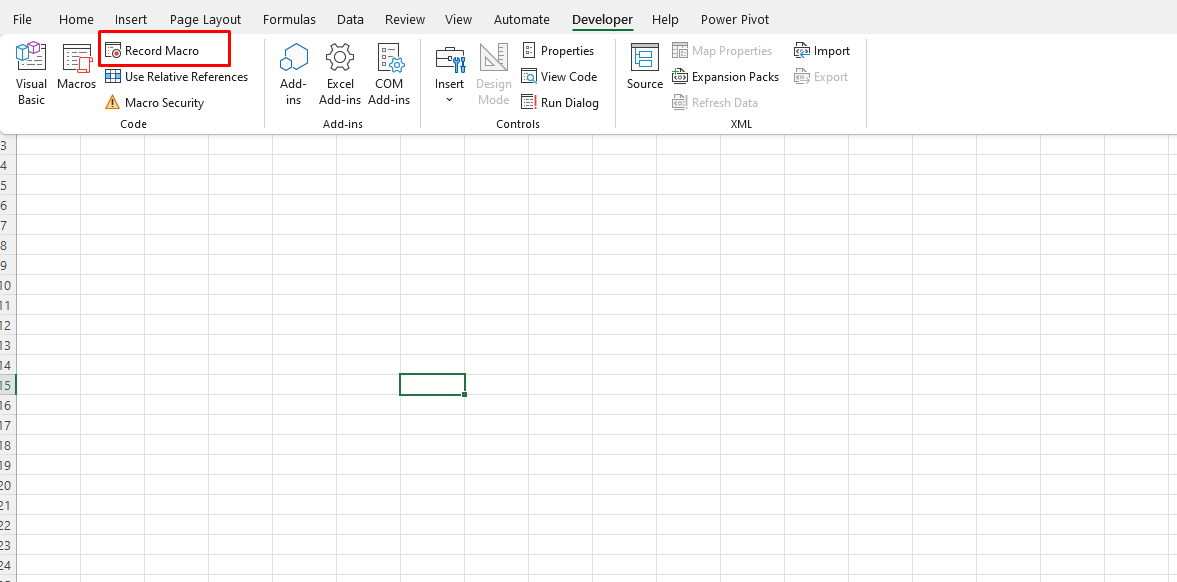
- Go to the ‘Developer’ tab and enable the ‘Record Macro’ option.
- Perform the repetitive task while recording.
- Save and assign the macro to a button for easy execution.

Example: Automating the creation of salary slips or updating performance reports.
8. Visualizing Trends with Conditional Formatting
Conditional formatting helps HR teams quickly identify patterns or outliers in their data.
Applications:
- Highlighting employees with low performance scores.
- Flagging departments with high absenteeism rates.
- Visualizing tenure distribution with data bars or color scales.
Example: Use color coding to identify high-risk employees for turnover based on engagement scores.
9. Employee Retention Analysis with Regression Models
Advanced users can leverage Excel for regression analysis to identify factors influencing employee retention.
Steps:
- Organize data into independent variables (e.g., salary, engagement score) and dependent variables (e.g., retention).
- Use the ‘Data Analysis Toolpak’ to perform regression.
- Interpret the output to determine significant predictors.
Example: Analyzing the impact of training hours and job satisfaction on retention rates.
10. Sharing Insights with Dynamic Reports
Sharing data insights effectively is crucial. Excel’s features allow you to create interactive and shareable reports.
Best Practices:
- Use PivotCharts and slicers for dynamic reporting.
- Protect sensitive data with Excel’s security features like password protection.
- Save reports as PDFs or upload them to cloud platforms like OneDrive for easy collaboration.
Example: A dynamic report summarizing recruitment metrics and workforce diversity for stakeholders.
Unlock the best deals on genuine Office keys at unbeatable prices—boost your productivity without overspending!

